Make SpatialPolygons object from GridTopology object
as.SpatialPolygons.GridTopology.RdConverts grids of regular rectangles into a SpatialPolygons object, which can be transformed to a different projection or datum with spTransform in package rgdal. The function is not suitable for high-resolution grids. The ordering of the grid cells is as in coordinates() of the same object, and is reported by IDvaluesGridTopology.
as.SpatialPolygons.GridTopology(grd, proj4string = CRS(as.character(NA)))
IDvaluesGridTopology(obj)
as.SpatialPolygons.SpatialPixels(obj)
IDvaluesSpatialPixels(obj)
HexPoints2SpatialPolygons(hex, dx)
Arguments
| grd |
|
|---|---|
| proj4string | object of class CRS-class |
| obj |
|
| hex |
|
| dx | spacing of two horizontally adjacent points; if missing, this will be computed from the points |
Value
as.SpatialPolygons.GridTopology and as.SpatialPolygons.SpatialPixels return a SpatialPolygons object;
IDvaluesGridTopology and IDvaluesSpatialPixels return a character vector with the object grid indices.
See also
GridTopology, SpatialPixels, SpatialPolygons
spTransform in package rgdal
Examples
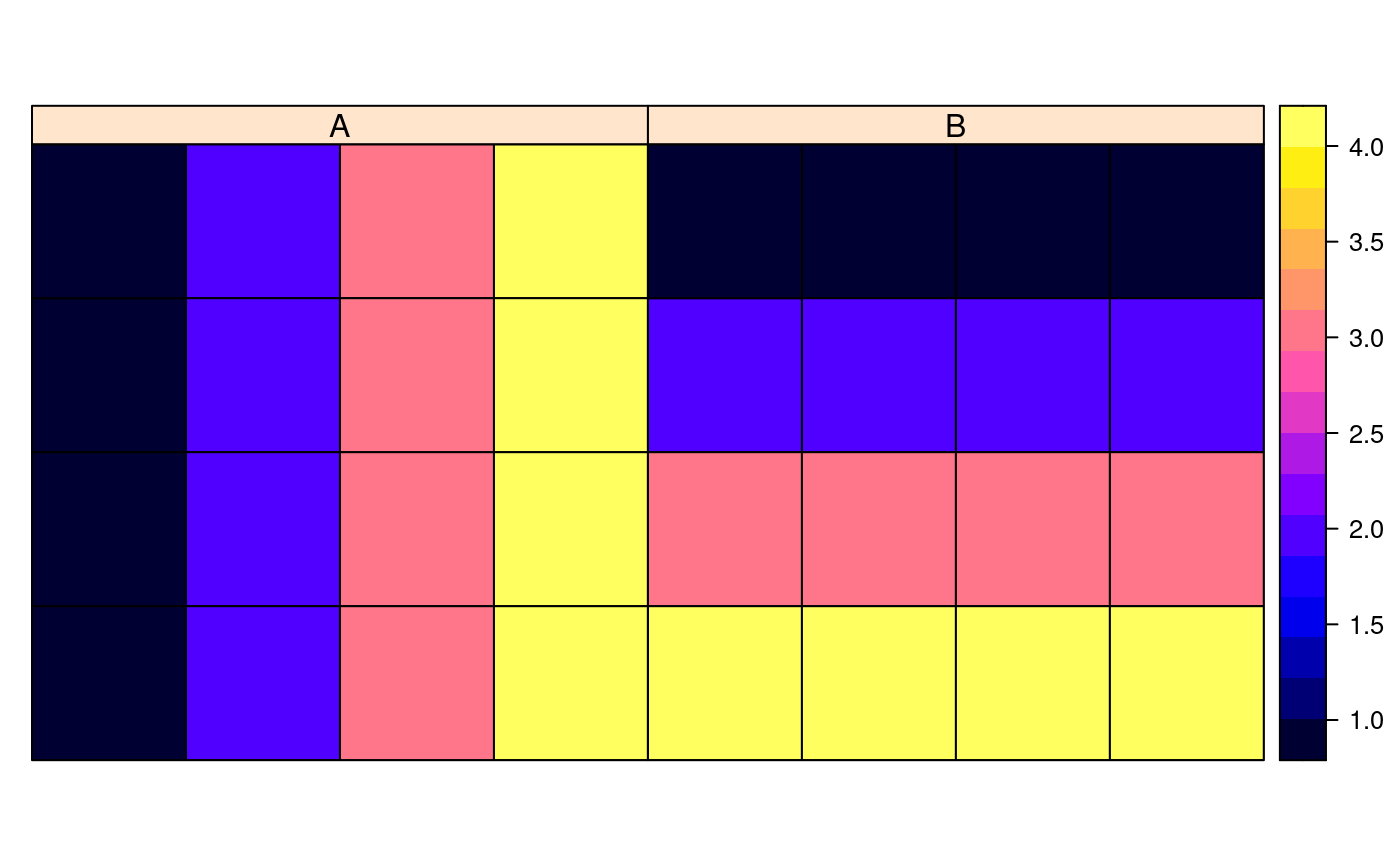
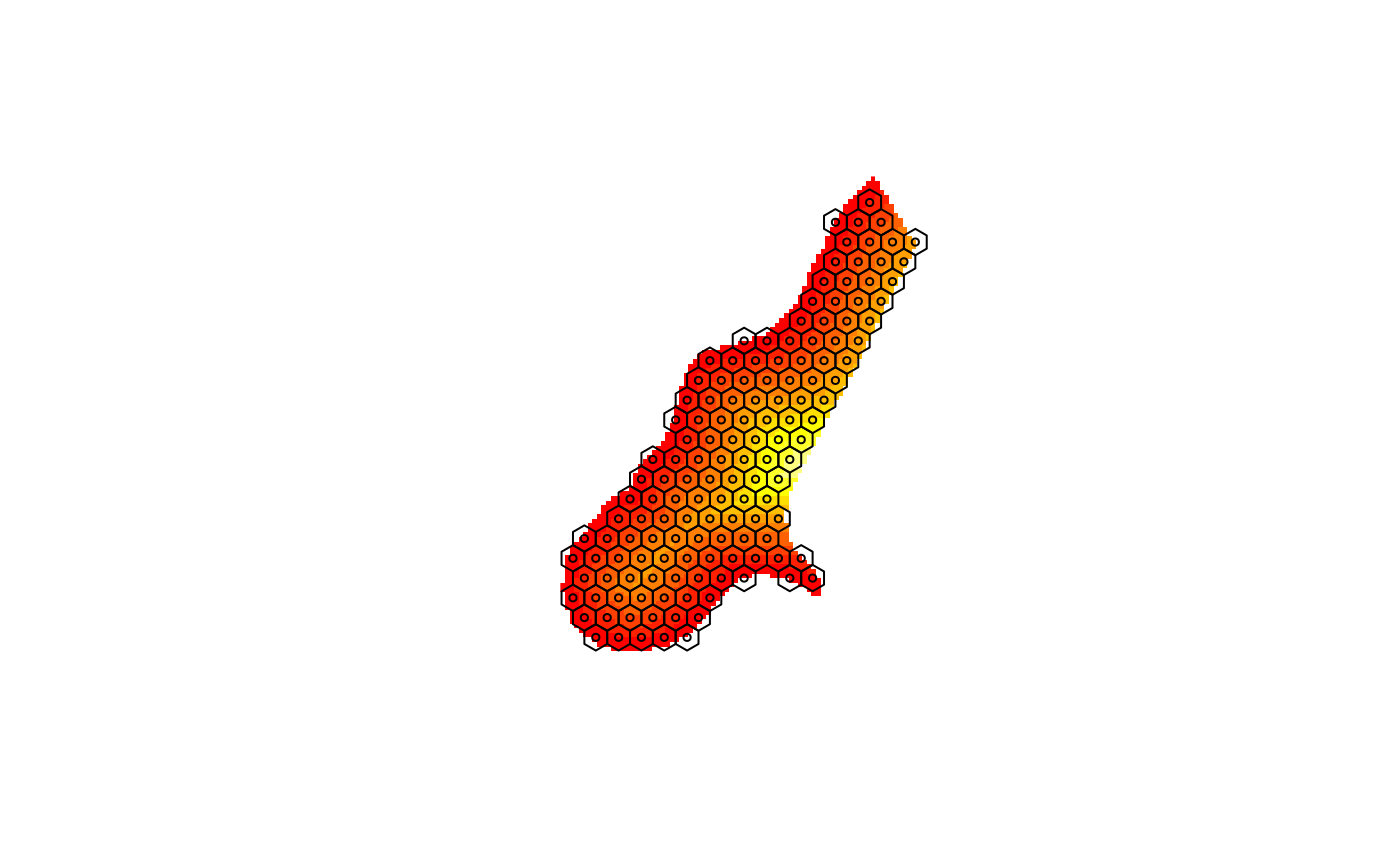
library(lattice) grd <- GridTopology(cellcentre.offset=c(-175,55), cellsize=c(10,10), cells.dim=c(4,4)) SpP_grd <- as.SpatialPolygons.GridTopology(grd) plot(SpP_grd)trdata <- data.frame(A=rep(c(1,2,3,4), 4), B=rep(c(1,2,3,4), each=4), row.names=sapply(slot(SpP_grd, "polygons"), function(i) slot(i, "ID"))) SpPDF <- SpatialPolygonsDataFrame(SpP_grd, trdata) spplot(SpPDF)data(meuse.grid) gridded(meuse.grid)=~x+y xx = spsample(meuse.grid, type="hexagonal", cellsize=200) xxpl = HexPoints2SpatialPolygons(xx) image(meuse.grid["dist"])