Modified envelope of K12hat from random toroidal shifts of two point patterns
Kenv.tor1.RdModification of Kenv.tor() to allow the assignment of a p value to the
goodness of fit, following the method outlined in Peter Diggle's 1986
paper (J Neurosci methods 18:115-125) and in his 2002 book.
Kenv.tor1(pts1, pts2, poly, nsim, s, quiet = FALSE)Arguments
- pts1
First point data set
- pts2
Second point data set
- poly
Polygon containing the points
- nsim
Number of random toroidal shifts to do
- s
Vector of distances at which to calculate the envelope
- quiet
If FALSE, print a message after every simulation for progress monitoring. If TRUE, print no messages
Value
A list with components: $upper, $lower, real, u, ksim, and rank. The first three
components are vectors like s, the next two contain results passed back from the simulations, and the final is a one-element vector with the rank of the observed data set.
See also
Examples
data(amacrines)
ama.a <- rbind(amacrines.on, amacrines.off)
ama.bb <- bboxx(bbox(as.points(ama.a)))
ama.t <- seq(from = 0.002, to=.250, by=0.002)
nsim=999
plot(amacrines.on, asp=1, pch=19,
main="Data set, match figure 1.4 of Diggle(2002)?")
points(amacrines.off, pch=1)
 #
k12 <- k12hat(amacrines.on, amacrines.off, ama.bb, ama.t)
#
k11 <- khat(amacrines.on, ama.bb, ama.t)
k22 <- khat(amacrines.off, ama.bb, ama.t)
k00 <- khat(ama.a, ama.bb, ama.t)
theor <- pi * (ama.t^2)
#
plot(ama.t, k12-theor, ylim=c(min( c(k12, k11, k22, k00) - theor),
max( c(k12, k11, k22, k00) - theor)),
main="2nd order properties, match figure 4.8 of Diggle (2002)", type="l")
lines(ama.t, -theor)
lines(ama.t, k11-theor, lty=2)
lines(ama.t, k22-theor, lty=3)
lines(ama.t, k00-theor, lty=5)
#
k12 <- k12hat(amacrines.on, amacrines.off, ama.bb, ama.t)
#
k11 <- khat(amacrines.on, ama.bb, ama.t)
k22 <- khat(amacrines.off, ama.bb, ama.t)
k00 <- khat(ama.a, ama.bb, ama.t)
theor <- pi * (ama.t^2)
#
plot(ama.t, k12-theor, ylim=c(min( c(k12, k11, k22, k00) - theor),
max( c(k12, k11, k22, k00) - theor)),
main="2nd order properties, match figure 4.8 of Diggle (2002)", type="l")
lines(ama.t, -theor)
lines(ama.t, k11-theor, lty=2)
lines(ama.t, k22-theor, lty=3)
lines(ama.t, k00-theor, lty=5)
 #
k12.tor <- Kenv.tor(amacrines.on, amacrines.off, ama.bb,
nsim, ama.t, quiet=TRUE)
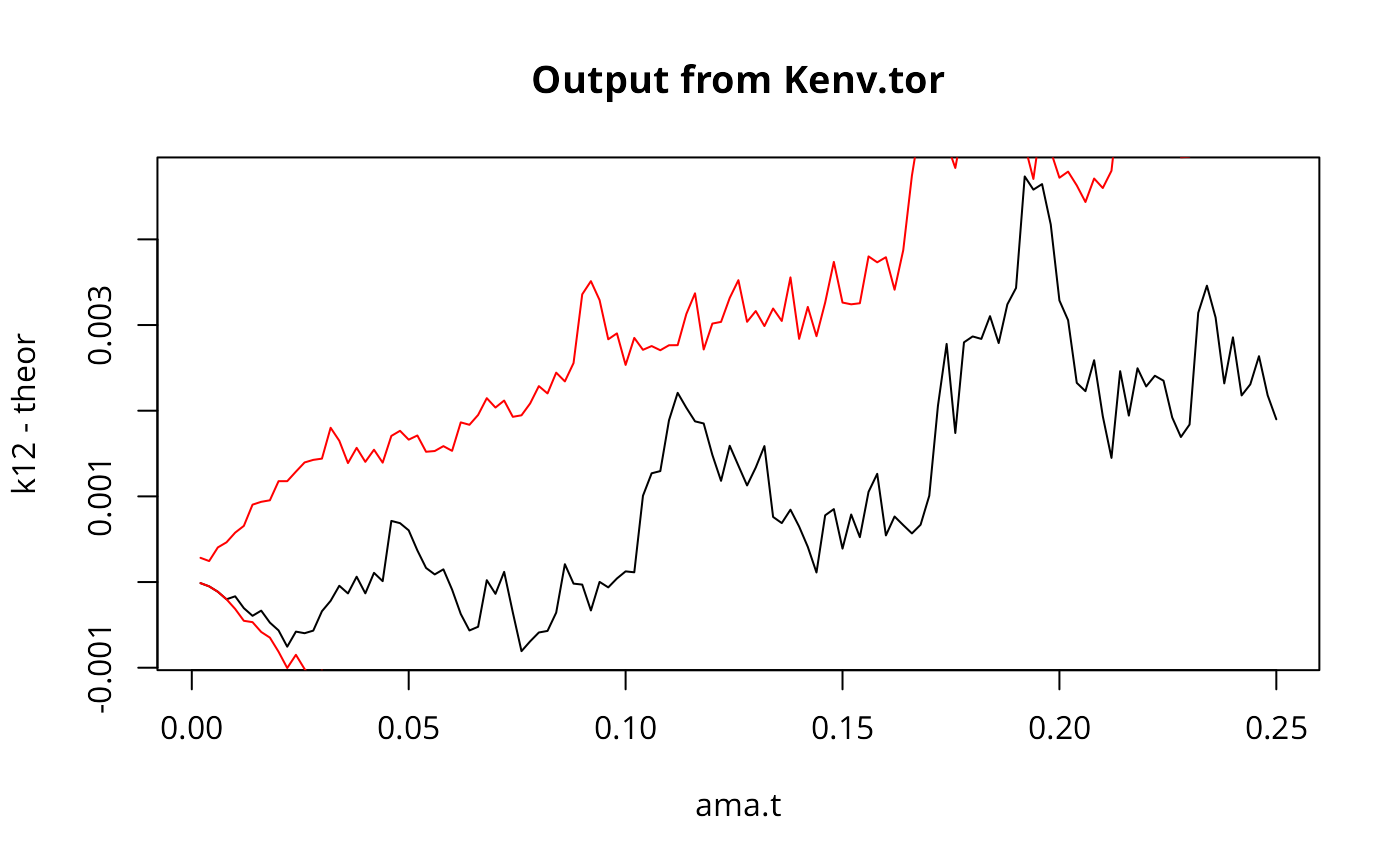
plot(ama.t, k12-theor, type="l", main="Output from Kenv.tor")
lines(ama.t, k12.tor$upper-theor, type="l", col="red")
lines(ama.t, k12.tor$lower-theor, type="l", col="red")
 #
k12.sims <- Kenv.tor1(amacrines.on, amacrines.off, ama.bb,
nsim, ama.t, quiet=TRUE)
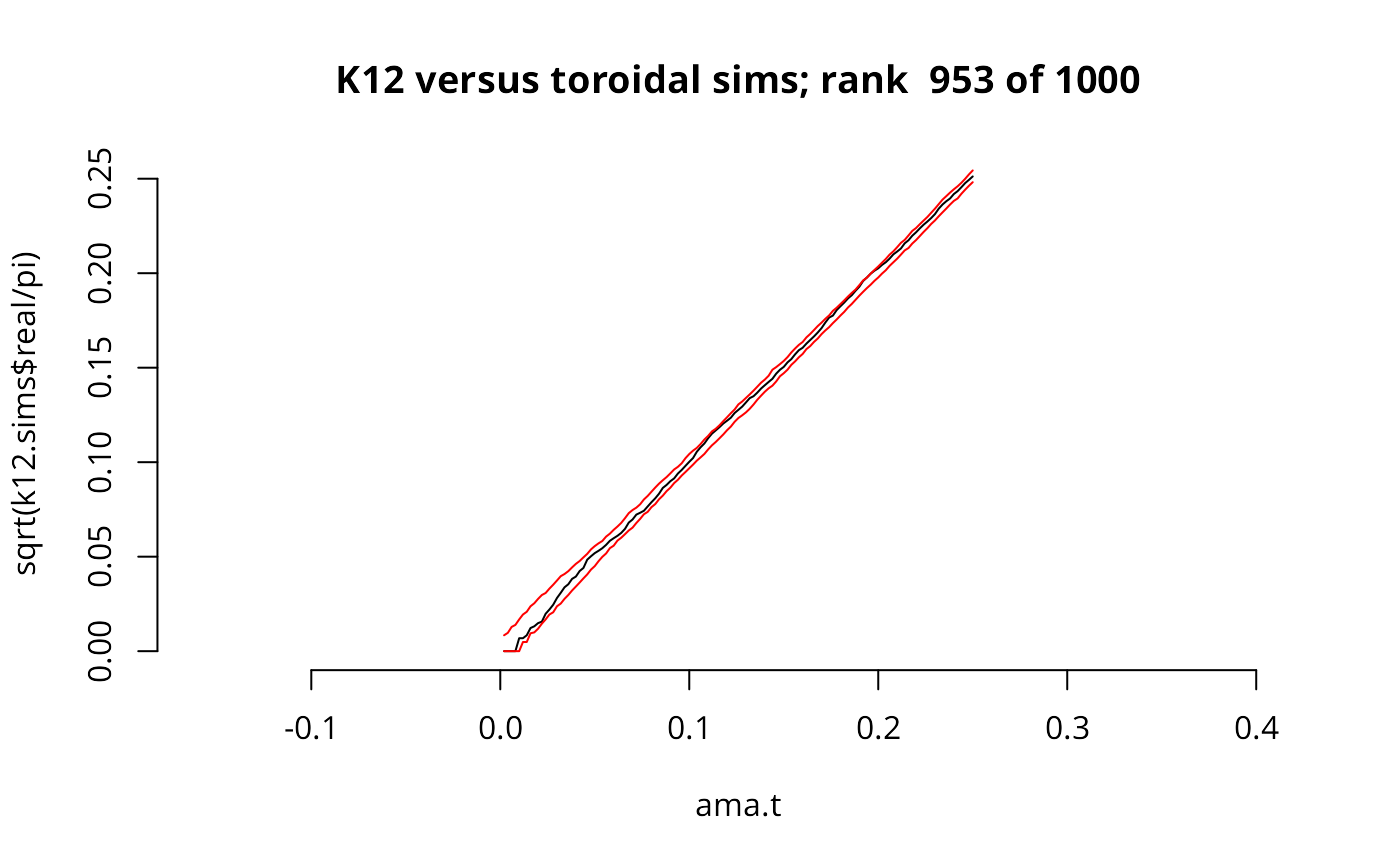
plot(ama.t, sqrt(k12.sims$real/pi), type="l", asp=1, bty="n",
main=paste("K12 versus toroidal sims; rank ", k12.sims$rank, "of",
length(k12.sims$u)))
lines(ama.t, sqrt(k12.sims$upper/pi), col="red")
lines(ama.t, sqrt(k12.sims$lower/pi), col="red")
